Tax and benefit changes disproportionately impact on women

DSCF2802
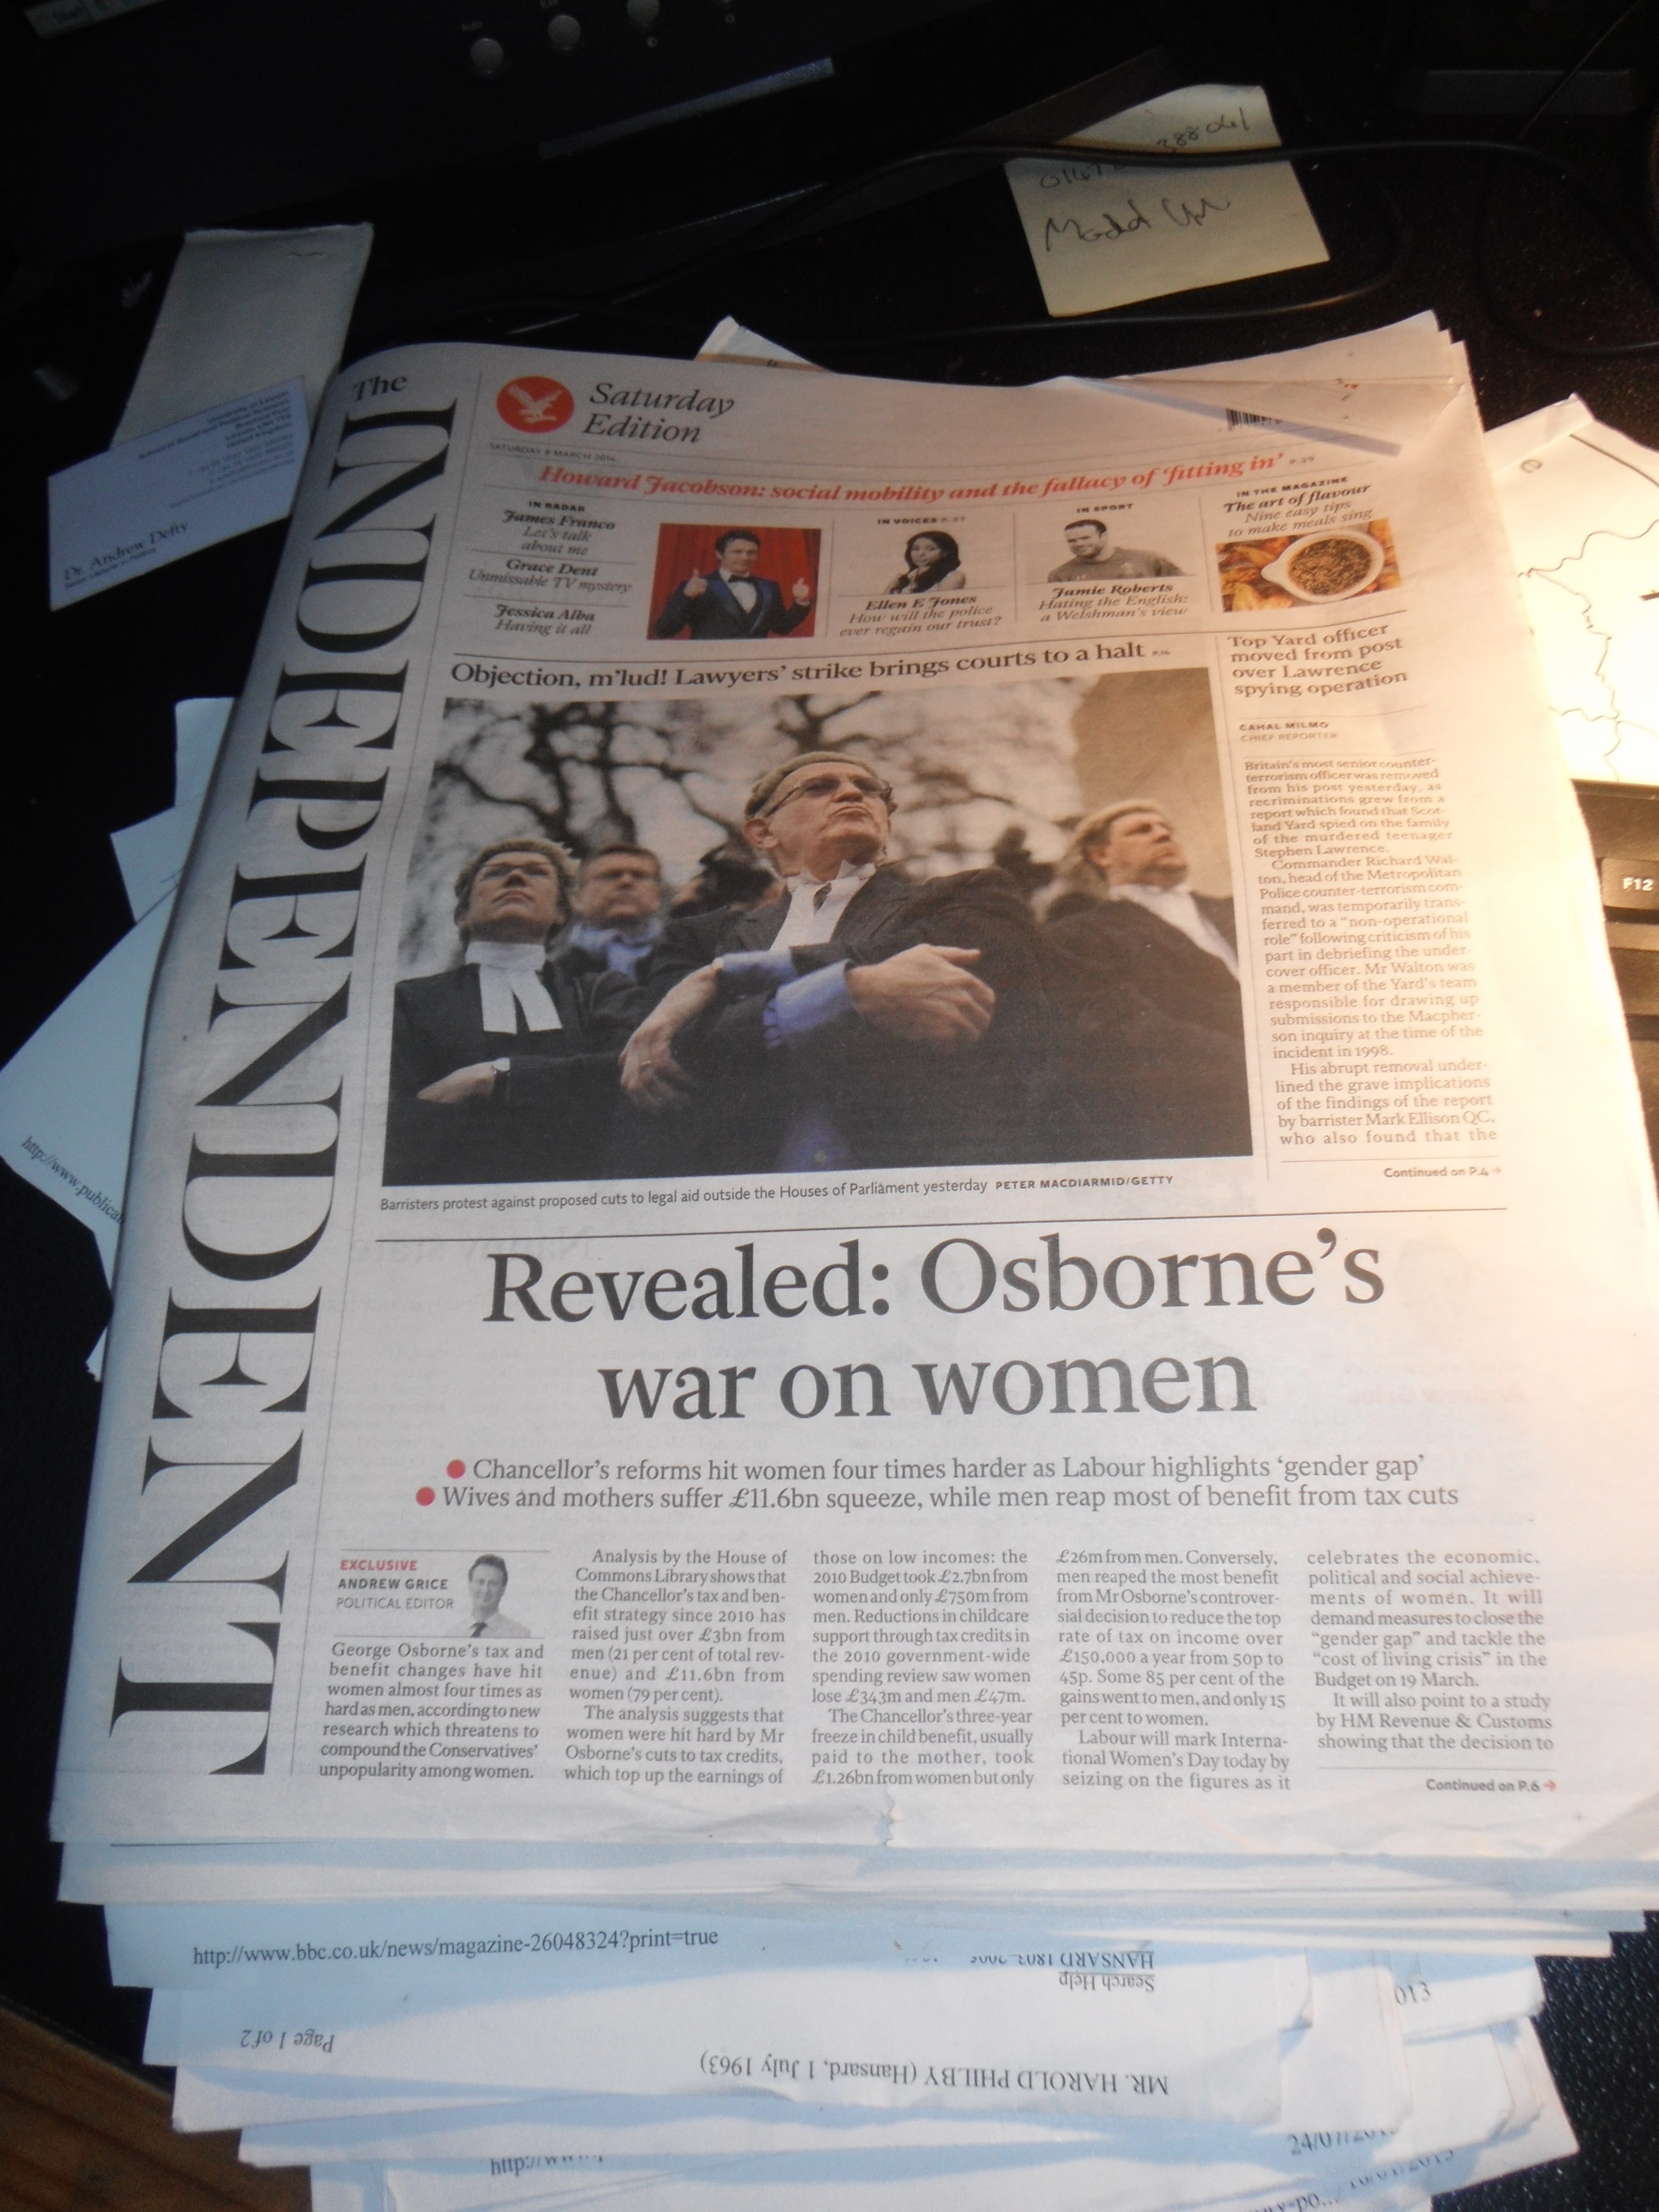
Following from my previous post, The Independent ran this story on its front page yesterday. Quoting analysis by the House of Commons Library it states that the Government’s tax changes and benefits cuts have disproportionately affected women, with women losing more through cuts to benefits, while men have disproportionately benefitted from tax cuts for higher earners.

Posted in Uncategorized | Tagged | Comments Off on Tax and benefit changes disproportionately impact on women

Who runs the world? Not girls!

WorkWhatever Beyonce may think, data released this week by the OECD suggest that women most certainly are not running the world, although they are clearly spending a great deal of time cleaning up after those who are.

To coincide with International Women’s Day on 8th March, the OECD published data on gender inequality in paid, unpaid work and leisure. This revealed that although women are doing less paid work than men, they do carry out a disproportionate amount of unpaid work and continue to take on the bulk of caring responsibilities, while men, on average, spend more time on leisure activities.

On average across the 26 OECD countries women spend around thirteen hours a week less than men in paid work. However, they are spending more than 32 hours each week on unpaid work,  more than twice as much time than men. When it comes to routine housework, across the OECD states, women are doing around twenty hours a week compared to eight hours for men. Similarly women spend twice as much time each week caring for other household members, this includes childcare but also presumably involves running around after the men in their lives. In short while the trend has been towards greater parity in terms of paid work (if not pay) the gender inequalities in unpaid work, including housework and caring responsibilities have remained. As the OECD observed, ‘Over the last 50 years, women decreased their hours of unpaid work as they increased the hours of paid work. Men have been doing more housework and child care, but they didn’t take up the slack so gender inequalities in the use of time are still large in all countries.’

The gender inequalities in the UK are stark. The UK has the longest working hours culture with more than 40% of men working in excess of 40 hours a week, and 20% of men working more than 50 hours a week. In contrast less than 20% of British women are working more than 40 hours a week while around 75% of women in the UK work between 1 and 39 hours a week a large proportion of whom are in part-time work.work2

However, the disparities in unpaid work are also marked. British women spend around 30 hours a week doing unpaid work, compared to 16 hours for men. In particular British women spend twice as much time than men each week, doing housework, looking after children and caring for other adults.

Interestingly the OECD figures did receive some coverage in the British press. The Daily Mail and The Daily Telegraph both ran stories under the headline ‘British women are the leisure queens of Europe.’ This was based on data which indicated that British women spend more time each week on leisure activities (around 40 hours) than women in every other OECD country except Norway. Although, as both newspapers also pointed out, (in much smaller print), this is still five hours a week less leisure time than British men. The simple fact is that British men may work longer hours, but they also spend more time enjoying themselves, while women are busy doing the housework and looking after the children.

It is important to remember that this is not just an argument about who does the washing up. Feminists have long argued that the power structures which one finds in the home are reflected in wider society, encapsulated in the maxim, ‘the personal is political’. These inequalities also present some very real and practical barriers to the representation of women in other areas of public life, includiong politics. There are significant disparities between the presence of women and men in a host of professions, and particularly in senior roles. Without wishing to make excuses for the obvious discrimination of women in the workplace, it is clear that the problems facing many British women who want to advance in their chosen profession begin long before they even leave home for work in the morning.

It’s a depressing picture and it is tempting in these cases to say that there are no simple solutions, but it seems to me that in this case there may be one. Men need to spend less time at work, less time on the golf course (sorry terrible gender stereotype there, but live with it) and more time at home doing the housework and engaging with their children.

Posted in Uncategorized | Tagged | Comments Off on Who runs the world? Not girls!

Tony Blair, Gordon Brown and Scottish Devolution

Sometimes there is material I would like to include in a lecture but just don’t have the space. The following extract from Tony Blair’s memoir, A Journey, is one example. It is illuminating and a little amusing. Interestingly when I shared this with a group of students a previous year, one commented that towards the end of this section it almost sounds as if Blair is talking about Gordon Brown, which is an interesting observation and raises the question of whether Brown tainted Blair’s view of the Scots, or whether the ‘prickly’ Scots tainted his view of Gordon. The extract is from pages 251-252:

I was never a passionate devolutionist. It is a dangerous game to play. You can never be sure where nationalist sentiment ends and separatist sentiment begins. I supported the UK, distrusted nationalism as a concept, and looked at the history books and worried whether we could get it through. However, though not passionate about it, I thought it inevitable. Just as the nationa state was having to combine with other in pushing power upwards in multinational organisations to meet global challenges, so there would be inexorable pressure to devolve power downwards to where people felt greater connection.

We didn’t want Scotland to feel the choice was status quo or separation. And it was a central part of our programme for Scotland. The Scots were notoriously prickly about the whole business.

I always thought it extraordinary: I was born in Scotland, my parents were raised there, we had lived there, I had been to school there, yet somehow – and this is the problem which nationalist sentiment unleashed – they (notice the ‘they’) contrived to make me feel alien.

Language has to be used carefully. They were incredibly sensitive to the fear that the Scottish Parliament would turn out to be a local council (which it never was). The Scottish media were a PhD dissertation about chippiness all unto themselves. They could spot a slight that to the naked eye was invisible. Once I gave an interview on why the Parliament should have tax-raising powers, in which I said: ‘If even a parish council can, why shouldn’t the Scottish Parliament?’ – which led to the headline ‘Blair compares parliament to parish council’, which even by their standards was quite some misinterpretations. Funnily enough, I quite liked them. They were hard to deal with, but it was sort of fun at the same time. T. Blair, A Journey, pp.251-2

Posted in Uncategorized | Tagged , , | Comments Off on Tony Blair, Gordon Brown and Scottish Devolution

Sense and sensibility: politicians, judges and the rise of judicial review

Judicial Reviews lodged 2007-2012 (Ministy of Justice, 2013)

Judicial Reviews lodged 2007-2012
(Ministy of Justice, 2013)

The rise in judicial review in recent years has brought the judiciary into conflict with governments of either persuasion. In the main this has involved judicial decisions on whether public bodies (the government, ministers and local authorities) have exceeded their powers by carrying out actions which the law did not give them the power to do. There have been a diverse range of cases, from the sentencing powers of the Home Secretary to the decision about where the remains of King Richard III should be interred. There has been a rash of recent cases in which individuals and groups have taken local authorities to court to challenge their decisions to impose cuts on things like library services and social care. Politicians, of either political hue, have perhaps not surprisingly been frustrated by what they see as judges seeking to overturn the democratic will of parliament. In this article in The Daily Telegraph from 2005, the former Conservative Home Secretary, Michael Howard, criticised the Labour Government for introducing the Human Rights Act, effectively enhancing the powers of the judiciary at the expense of parliament. Labour Ministers too, came to regret this apparent enhancement of judicial power. The former Labour Home Secretary David Blunkett has been a particularly vocal critic of judicial activism, as is exemplified in the following extract from his diaries:

 Judicial review is a modern invention. It has been substantially in being from the early 1980s, and although it was designed to prevent administrative abuse – where there was no parliamentary authority and where bureaucrats were exercising undue power – it had rapidly become and entirely new arm of our constitution, operated by judges, through judges, and without any redress or accountability to Parliament. In fact unlike statute law, there is a presumption that this is both outside the remit of parliament and a check on Parliament. I accept, as all democrats do, that it is the right of the independent judiciary to question the implementation of laws where those laws are not in line with the policy intent or the legislative measures passed by Parliament, but not that the intent and policy objective of Parliament can be overturned as though we have a written constitution, and a Supreme Court as a separate arm of that Constitution, as in the United States – not least because in the United States the Supreme Court is appointed through the Presidency and is scrutinised by the legislature. In Britain judicial review is all about the rights of the individual over the rights of society. David Blunkett, The Blunkett Tapes: My Life in the Bear Pit, London: bloomsbury.  

The current government has been strongly critical of what it sees as the growth in time-wasting appeals against various aspects of government policy. In a recent article in The Daily Mail, the Justice Secretary, Chris Grayling, bemoaned the use of judicial review by campaign groups as a legal delaying tactic designed to stop government development project ‘often delaying an innovation that would bring  economic benefits and jobs.’ Such groups, Grayling bizarrely claimed, are often led by left-wing campaigners who flooded the charitable sector in an exodus from Westminister following the last general election, and are now busy exploiting the legal system in order to ‘articulate a left-wing vision which is neither affordable nor deliverable.’

However, while Grayling, and the Prime Minister, have both attacked judicial review as a break on large scale commercial projects, as the BBC’s legal correspondent Clive Coleman, points out figures for judicial review indicate that the majority of cases of judicial review relate to immigration and asylum appeals and that the increase in cases involving commercial planning and building has been negligible. This is clear in the graph above, which is drawn from the Ministry of Justice’s own figures and shows the number of judicial reviews lodged since 2007. It indicates a clear rise in the total number of applications, but this is mirrored very closely by the rise in appeals against immigration and asylum decisions. Reviews in relation to planning decisions, which are included in the ‘civil – other’ category have seen little if any rise since 2007. Moreover, the graph is taken from a Ministry of Justice statistical notice issued last month which revised down the figures on judicial review in the ‘civil – other’ category, which had shown a slight rise in the previous statistical notice issued in June. There is then very little evidence for a rise in judicial reviews against development projects since the 2010 general election. There remain questions both about the capacity of the legal system to handle the overall rise in cases, and perhaps more significantly about the growing propensity of politicians to question the power of the judiciary, but a more accurate appraisal of the problem would certainly be more helpful.

Posted in Uncategorized | Tagged , , | 1 Comment

Who Runs Britain? November Poll

The results of this year’s second Who Runs Britain? poll are as follows:

Table 1: Voting Intention – if there were a general election tomorrow which party would you vote for?

Party

Number

%

Conservative

16

32

Labour

18

36

Liberal   Democrat

2

4

Green   Party

9

18

UK   Independence   Party

4

8

Some   other party

1

2

Don’t   Know

2

4

I   would not vote

3

5

Total

55

The other party was The Libertarian Party.

The figures were calculated as follows.

In calculating the percentage support for each party the responses Don’t know and I would not vote were excluded, ie the total used was 50  not 55.

In calculating the percentage of Don’t know and I would not vote responses, the figure for all responses was used, ie the total used was 55.

 Table 2: Voting intention change 2013 tracker – if there were a general election tomorrow which party would you vote for?

Party

Oct

2013

Nov

2013

Conservative

35

32

Labour

41

36

Liberal   Democrat

3

4

Green   Party

10

18

UK Independence Party

5

8

Some   other party

6

2

Don’t   Know

4

4

I would   not vote

4

5

Turnout

90

71

What does the poll tell us?

Please keep in mind the usual health warning about the small size of the sample, and the rather unrepresentative nature of a group of undergraduate politics students (see the previous poll for a more detailed health warning). The most obvious point is that Labour remains in the lead with 36% of the vote. However, Labour’s lead over the Conservatives has narrowed from 6 points to 4 points since our first poll in October. Support for the Liberal Democrats remains static with 2 votes in both polls. The slight percentage rise is due to the smaller turnout. The Green Party remains the third party in our poll, and they are the only party to have attracted more votes in this poll than in the October poll, despite a decline in turnout.

Since I started running these polls in 2009 a diverse range of parties have featured in the ‘other party’ box, and this poll was no exception. This is the first showing in the Who Runs Britain? polls for the Libertarian Party. The UK Libertarian Party was formed in 2008 and advocates classical liberal economic policies based on minimal state intervention in the economy, low taxes and the deregulation of business, coupled with socially liberal policies based around support for civil liberties such as freedom of speech, and the decentralisation of services such as health and education. The party has had very little electoral impact, although they did gain their first council seat in 2009 when a Liberal Democrat councillor in Stoke on Trent defected to the Libertarian Party.

The National Picture

If we compare the poll with recent public opinion polls we see that, as with the previous poll, this poll is remarkably similar to national polls taken at the same time. There were two national polls which completed their survey on the same day as our poll. Both had Labour 6 points ahead of the Conservatives, a wider margin than in our poll, but the level of support for the two main parties is broadly the same across all three polls. The Liberal Democrats have consistently polled higher in national polls than in any Who Runs Britain? polls since November 2010 which may or may not be a source of comfort for Nick Clegg. Support for UKIP is also lower in our poll, and for the Green Party considerably higher.

Table 3: Comparison with YouGov/Sunday Times poll of 10-11 October 2013

Party Who Runs Britain? poll

15/11/13

YouGov/Sunday Times Poll

15/11/13

ComRes/IoS   15/11/13
Conservative

32

33

29

Labour

36

39

35

Liberal Democrat

4

10

10

UKIP

8

12

17

(source: UK Polling Report )

Previous cohorts of Who Runs Britain? students

As mentioned in the previous poll I began polling first year students on this module in 2009. I poll each cohort at the beginning of their degree, and then on four further occasions throughout the year. The chart below shows the Who Runs Britain? tracker poll. As mentioned previously the gap between support for Labour and the Conservatives in this year’s cohort is considerably narrower than last year, although Labour remain in the lead. Indeed, this is a narrower gap than at any point since the first poll of the 2011-2012 cohort in October 2011, although in that case the Conservatives were ahead. It is also interesting to note that, in all cohorts except the 2011-2012 cohort, the gap between the two main parties has narrowed between the first and second poll each year. This may suggest that students begin to question their voting preferences following their arrival at University. However, what is particularly interesting is that across several cohorts the Labour vote seems to suffer most between the first and second polls. In four out of the five cohorts 2010-11, 11-12, 12-13 and this year there has been a decline in the Labour vote between the first and second poll, while the Conservative vote has declined twice in 2009-10 and this year, increased twice, in 2010-11 and 2011-12, and was unchanged in 2012-2013. One possible explanation for this is that turnout always declines between the first and second poll, and, as I have observed in the past, a decline in turnout seems to impact more on the Labour vote. The admittedly controversial hypothesis that one might draw from this is that Conservative voting students are better attenders.

Tracker

Party Leaders’ Approval Ratings

In this poll I also took the opportunity to poll you on how well you thought the leaders of each of the three main parties were doing. I used a standard approval rating question allowing you to rate their performance as fairly/very well or fairly/very badly. The results of this poll were particularly interesting. Despite the fact that Labour are clearly ahead of the Conservatives in terms of voting intention, the majority of those polled (59%) thought that David Cameron is doing fairly or very well, compared to only 24% who felt that Ed Miliband is doing a good job. Indeed  very large majorities thought that Miliband (72%) and Clegg (81%) are doing badly. We can calculate a net approval rating by looking at the difference between those who think the leaders are doing well or badly. This shows that Cameron is the only one of the three leaders with a positive net approval rating (+19), ie with more people thinking he is doing well than badly. In contrast Miliband has a net approval rating of -48 and Clegg’s is a huge -69.

Table 4: How well do you think…. is doing as party leader/Prime Minister? (percentage valid responses).


Cameron

Miliband

Clegg

Very   well

6

2

6

Fairly   well

53

22

6

Total   well

59

24

12

Fairly   badly

22

46

31

Very   badly

18

26

49

Total   badly

40

72

81<%

Posted in Uncategorized | Comments Off on Who Runs Britain? November Poll