List of Parliamentary Private Secretaries: a reply from No.10

10DS
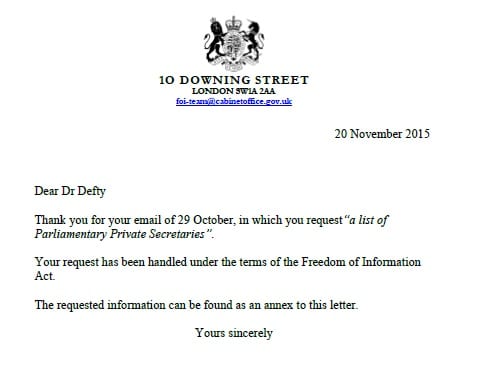
Two weeks ago I wrote a post about my frustration at being unable to find a list of Parliamentary Private Secretaries. The coalition government had published a list in 2010 but this has never been updated. On the suggestion of the House of Commons Library, who were also unable to find a list, I contacted Downing Street. The reply is opposite and the full Government PPS list is below:

Cabinet:

  • The Prime Minister: GAVIN WILLIAMSON
  • First Secretary of State and Chancellor of the Exchequer – George Osborne – CHRIS SKIDMORE
  • Home Secretary – Theresa May – MICHAEL ELLIS
  • Foreign Secretary – Philip Hammond – CHRIS PINCHER
  • Lord Chancellor and Secretary of State for Justice – Michael Gove – ROBERT JENRICK
  • Secretary of State for Defence – Michael Fallon – GRAHAM EVANS
  • Secretary of State for Work and Pensions – Iain Duncan Smith – DAVID RUTLEY
  • Secretary of State for Health – Jeremy Hunt – STEVE BRINE
  • Leader of the Commons and Lord President of the Council – Chris Grayling – MIKE FREER
  • Secretary of State for International Development – Justine Greening – ANDREW BINGHAM
  • Secretary of State for Education and Minister for Women & Equalities – Nicky Morgan – ROBIN WALKER.
  • Leader of the House of Lords and Lord Privy Seal – Baroness Stowell – KWASI KWARTENG
  • Secretary of State for Transport – Patrick McLoughlin – STUART ANDREW
  • Secretary of State for Business, Innovation and Skills – Sajid Javid – JOHN GLEN
  • Secretary of State for Northern Ireland – Theresa Villiers – REBECCA HARRIS
  • Secretary of State for Environment, Food and Rural Affairs – Liz Truss – MARK SPENCER
  • Secretary of State for Communities and Local Government – Greg Clark – HENRY SMITH
  • Secretary of State for Wales – Stephen Crabb – DAVID MORRIS
  • Chancellor of the Duchy of Lancaster – Oliver Letwin – ALOK SHARMA
  • Secretary of State for Culture, Media and Sport – John Whittingdale – HEATHER WHEELER
  • Secretary of State for Scotland – David Mundell – IAIN STEWART
  • Secretary of State for Energy and Climate Change – Amber Rudd – PAUL MAYNARD

Ministers attending Cabinet:

  • Chief Secretary to the Treasury – Greg Hands – JAKE BERRY
  • DWP: Minister of State – Priti Patel – ALEC SHELBROOKE
  • BIS: Minister of State – Anna Soubry – MARK PAWSEY
  • CO: Minister of State and Paymaster General – Matthew Hancock – GARETH JOHNSON
  • Minister without Portfolio – Robert Halfon – ANDREW STEPHENSON
  • Attorney General – Jeremy Wright – REHMAN CHISHTI

Ministers of State:

  • Financial Secretary to the Treasury – David Gauke – CONOR BURNS
  • Home Office: Minister of State – James Brokenshire – CRAIG WHITTAKER
  • Home Office/MOJ: Ministers of State – John Hayes and Mike Penning – CHRIS WHITE
  • FCO: Minister of State – David Lidington – JAMES MORRIS
  • FCO: Minister of State – Hugo Swire – PAULINE LATHAM
  • MOD: Ministers of State – Philip Dunne and Penny Mordaunt – OLIVER COLVILE
  • Health: Minister of State – Alistair Burt – KAREN LUMLEY
  • DfID: Ministers of State – Desmond Swayne and Grant Shapps – CHARLOTTE LESLIE
  • DfE: Ministers of State – Nick Gibb and Edward Timpson – STEPHEN METCALFE
  • BIS: Ministers of State – Nick Boles and Jo Johnson – ANNE MARIE MORRIS
  • BIS/DCMS & DECC: Ministers of State – Ed Vaizey and Andrea Leadsom – SHERYLL MURRAY
  • DEFRA: Minister of State – George Eustice – MATTHEW OFFORD
  • DCLG: Ministers of State – Mark Francois and Brandon Lewis – ANDREW GRIFFITHS

The Payroll Vote 

What does this mean for the payroll vote? There are 41 PPSs which is an average of around one PPS for every two Ministers. There are a total of 91 Ministers and Whips in the House of Commons which means that the payroll vote comprises 132 MPs or 40% of Conservative MPs.

Interestingly, it is not clear if this list has been made public anywhere else. I didn’t submit my request through the whatdotheyknow.com website or indeed as an FOI request, although it was treated as one. The relevant page on the gov.uk website has not been updated. The reply from Downing Street was admirably quick but with the exception of this post, it is far from clear to me that this information is any easier to find now than it was two weeks ago.

Posted in Uncategorized | Tagged , , | 3 Comments

What role will Parliament play in Britain’s response to terrorist threat?

The terrorist attacks in Paris will raise understandable concerns about the threat of further attacks, including in the UK. Although Paris has suffered two serious attacks this year the government will be keen to ensure that the British public are not complacent about the threat of attacks in the UK. The system of publishing threat levels within the UK was introduced following the Bali bombings in 2002. The current threat level of ‘severe’ has been in place since August 2014 when it was raised in response to the conflict in Syria. The government has not chosen to raise that to the highest level, ‘critical’, which means that it does not at this time have specific intelligence of an imminent threat of attack within the UK, but does mean that an attack remains highly likely.

In the longer term these attacks will certainly change the context in which Britain develops its own response to terrorist threats. The government is currently seeking to introduce controversial new surveillance powers for the British intelligence and security agencies, which were included in the draft Investigatory Powers Bill published a little over a week ago. While supporters of the Bill will wish to stress that attacks such as these reinforce the need for additional powers. Opponents of these proposals, including many within the Prime Minister’s own party, will argue that what is needed is better intelligence about what are often known threats, rather than additional powers to facilitate mass surveillance.

The attacks will also, once again, raise the possibility of another Parliamentary vote on British participation in military action in Syria. The Prime Minister will not want to risk losing another vote on this issue and is therefore only likely to seek one if he is confident of winning. However, this has also raised the question of whether the Prime Minister should have to seek parliamentary approval for sending British forces into action. The convention that the Prime Minister must seek the approval of Parliament before embarking on military action is a relatively new development, established by Tony Blair in relation to Iraq in 2003 and applied by the current Prime Minister in relation to the conflicts in Libya and Syria. However, most previous Prime Ministers have not been bound in this way and there are certainly some who would argue that when serious issues of national security are at stake the Prime Minster should be able to lead without seeking the approval of Parliament.

Either way, the Paris attacks will certainly strengthen the arguments in favour of intervention. One factor which may influence opinion here is the response of Britain’s NATO allies. President Hollande’s declaration that the attacks amount to an act of war raises the possibility of an invocation of article 5 of the North Atlantic Treaty, which states that an armed attack against one member state constitutes an armed attack against them all. The only previous occasion on which article 5 has been invoked was following the attacks of September 11, 2001. In order for article 5 to be invoked it would need the approval of all 28 NATO member states. Crucially, however, article 5 does not specify how member states should respond. Nevertheless, such a move would be a significant development and there would be considerable pressure for Britain to step up its involvement in Syria.


This is a slightly longer version of a piece which was posted on The Lincolnshire Echo’s website last week.

Posted in Uncategorized | Tagged , , | Comments Off on What role will Parliament play in Britain’s response to terrorist threat?

Press affiliation and the 2015 general election

sunAt the 2015 general election five out of eleven national daily newspapers supported the Conservative Party. Only two supported Labour, The Mirror and The Guardian, although this was an improvement on 2010 when The Guardian, somewhat bizarrely, encouraged its readers to vote Liberal Democrat. Liberal Democrat support this time was confined to The Independent and its tabloid partner i, although The Independent somewhat complicated matters by advocating a continuation of the coalition government, something which would not, of course, appear on the ballot paper. UKIP gained the support of the Express which had supported the Conservatives in 2010. In terms of circulation, Conservative press share in 2015 was 71% compared to 15% for Labour and 5% for the Liberal Democrats. Just two newspapers, The Sun and The Daily Mail, delivered more than 50% press share to the Conservatives.

press share

The overwhelming Conservative domination of the press would seem to reinforce the argument that press support is central to electoral fortunes. Moreover, as Wilks-Heeg, Blick and Crone have shown  across recent elections press affiliation appears to be swinging more dramatically between the parties and in line with electoral outcomes. As they show for most of the post-war years press share between the main parties remained stable with the Conservatives having around 50-55%, while Labour sat on 38-44%. This changed in 1979 when for four successive general elections Conservative press share exceeded 64% (over 70% from 1979-1987), this was followed by three successive general elections in which Labour’s press share did not drop below 58%. In 2010, press affiliation shifted back to the Conservatives who have retained 71% press share for the last two general elections.

The parties clearly think press support is important and the fact that there are now clear winners and losers in this competition almost certainly has an impact on party morale during election campaigns. However, it is, of course, hard to know exactly what influence if any, the press has on voting behaviour and in particular whether this is evidence of newspapers following public opinion in order to hang to readers or of the press influencing the voting behaviour of their readers.

There are a number of reasons to doubt that the press has a decisive influence on voting behaviour. There is clearly no direct correlation between press share and share of the vote. Historically Conservative press share has exceeded their share of the vote, while Labour’s press share, particularly in recent years, has tended to fall below theirs. Moreover, since the 1980s the Liberal Democrats have secured large shares of the vote with very little or no press support. Most notably in 1997, the Liberal Democrats secured 17% of the vote and 46 MPs despite not having the support of a single national daily newspaper. In 2015, Conservative press share was almost double their share of the vote, while for Labour, the Liberal Democrats and UKIP their press share was roughly half of their vote share.

It is apparent then that, while Britain has a highly partisan press, the newspaper one reads does not necessarily define one’s political affiliation. There is clearly some link, polling data from 2015 clearly indicates that the majority of Guardian and Mirror readers vote Labour while the overwhelming majority of Telegraph and Daily Mail readers vote Conservative. However, a small proportion of Guardian readers vote Conservative(6%) while a similarly small proportion of Telegraph readers (9%) voters Conservative. In the course of our research on MPs’ attitudes to welfare, it was clear that a large proportion of Labour MPs are avid readers of The Daily Mail, and not always to find out what the opposition thinks.

Moreover, in order for a newspaper to influence its readership it is necessary for the readership to know what its political affiliation is and also for them to vote. While considerable attention and effort from the parties has focused on securing the support of The Sun, research on the 1997 general election suggested that any shift in allegiance on the part of the newspaper and its readers was largely offset by the large proportion of Sun readers who simply do not vote, as many as one in four. Moreover, despite well-publicised shifts in allegiance there is evidence to suggest that a large proportion of Sun readers are unaware of the paper’s political allegiances. Polling by Lord Ashcroft albeit in 2012, long before the general election, indicated that less than half of Sun readers correctly identified which party their newspaper supported. Sun readers were more likely to say they did not know which party the newspaper supported and more than twice as likely to wrongly identify its politics than readers of other national daily newspapers.

What is also striking about table 1 above is that the national daily newspaper readership in the UK is tiny. The circulation of daily newspapers in the UK is in, seemingly terminal, decline. National daily newspapers lost around half a million readers (7.6%) in the year prior to the general election. Out of a total electorate in May 2015 of around 45 million, the total daily circulation of national newspapers in the UK was around 7 million, one in six voters. The circulation of some national newspapers is so small one wonders how they stay in business. The daily circulation of The Independent, at 60,400 is not much higher than for some of the larger regional newspapers in the UK. It is tempting to conclude that the entire readership of The Guardian is made up of the 190,000+ academics in UK universities. It is hard to attribute significant political influence to newspapers which are read by such a small proportion of the voting public.

However, while print sales are in decline this has been at least partly offset by the online presence of Britain’s daily newspapers which has grown significantly in recent years. Assessing the impact of Britain’s online media is even more difficult than trying to determine the impact of the print media. While the print circulation of national dailies is almost exclusively within the UK, online editions can be accessed from anywhere in the world. The situation is complicated by the fact that the Audit Bureau of Circulation with provides figures for web traffic does not provide figures for those newspapers which operate behind a paywall. Moreover, the nature of online browsing may mean that readers are more likely to be led directly to the story they are interested in without being distracted by extraneous stuff, like politics. It is noticeable that traffic to UK national newspapers fell in the month leading up to the general election. It is also the case that while one is likely to buy only one copy of a newspaper one might visit its website on several occasions, and from several different computers, in any one day.

Nevertheless, the daily average web traffic for UK national newspapers (table 2) is dramatically higher than their print circulation. If taken together they provide a notional figure which is much closer to the total UK electorate, although this is clearly methodologically problematic for the reasons set out above. Moreover, while the Mail Online is the dominant web presence, newspapers which have a relatively low print circulation, notably The Guardian and The Independent, have a significant online reach. In contrast The Sun is a relatively small online player, it has operated behind a paywall since 2013 and only recently (since the general election) began to make more of its content available for free. The traffic figures for The Sun are, nevertheless, less than half those of The Independent and a quarter those of the Mirror.online

Britain has a highly partisan press and in recent years political parties have spent a great deal of energy and money chasing the endorsement of various sections of the print media. However, there are significant questions about whether this has a significant or indeed any impact on electoral fortunes. On the basis of the 2015 general election while it may be too soon to say that parties can relax about the political endorsement of the press, they can perhaps afford to be less obsessed and think more broadly about where voters are getting their political information.

Posted in Uncategorized | Tagged , , | Comments Off on Press affiliation and the 2015 general election

The 2015 general election in numbers

The election

Number of seats contested: 650

Number of candidates: 3,971, down slightly since 2010 but second highest since the war.

Number of women candidates: 1033, 26% the largest number and percentage of women candidates at a UK general election.

Proportion of women candidates by party: SNP, 38%; Green Party, 38%; Labour, 34%; Conservatives, 26%; Liberal Democrats 26%; Plaid Cymr, 25%; UKIP, 13%.

Party with largest increase in the number of candidates: The Green Party, 573 candidates up from 310 in 2010.

Party with the largest fall in the number of candidates: The BNP, 8 candidates compared to 325 in 2010.

The results

Votes  Vote Share % Seats Net Gain
 Con  11,334,576  36.9 331  +24
 Lab  9,347,304  30.4  232  -26
 SNP  1,454,436  4.7  56  +50
 LD  2,415,862  7.9  8  -49
 DUP  184,260  0.6  8  0
 SF  176,232  0.6  4  -1
 Plaid  181,704  0.6  3  0
 SDLP  99,809  0.3  3  0
 UUP  114,935  0.4  2  +2
UKIP 3,881,099 12.6 1 +1
Green 1,157,613 3.8 1 0
Others 164,822 0.5 1 0

Turnout

Turnout: 66.2%, the highest since 1997 but still the fourth lowest since 1918.

Seat with the highest turnout: Dunbartonshire East, 81.9%.

Seat with the lowest turnout: Stoke on Trent Central, 51.3%.

Average turnout in seats won by Labour: 61.8%.

Average turnout in seats won by the Conservatives: 68.7%.

Turnout was lowest in 18-24 year olds: 43%.

Turnout was highest amongst over 65s: 78%.

Spoilt ballots: 0.3%.

The Parties

Number of parties winning seats: 11

Number of seats which changed hands from 2010: 111 (Gains: 50 to the SNP; 35 Conservative, 22 Labour).

Number of independent candidates winning seats: 1, Sylvia Hermon, North Down.

Most successful party: the SNP, 95% of candidates elected, compared to 51% of Conservative candidates, 37% of Labour candidates and 1.26% of Liberal Democrats candidates, 0.16% of UKIP candidates.

Number of seats won by the SNP which it did not hold in 2010: 50.

Number of seats SNP won from Labour: 40, and 10 from Liberal Democrats.

Number of seats the SNP won from the Conservatives: 0.

Number of Conservatives’ 330 seats which are in England: 318.

Third largest party in terms of votes: UKIP 3,881,099, 1 seat

Thirds largest party in terms of seats: SNP 56 seats, 1,454,436 votes.

Number of £500 deposits lost by the Liberal Democrats: 340 out of 631 (£170,000), up from 0 in 2010.

Share of the vote & seats

Share of the vote for parties other than the Conservatives: 63.1%.

Share of the vote going to parties other than Conservative, Labour and Liberal Democrat: 24.9%, a record.

Share of the vote going to parties other than Conservative, Labour, Liberal Democrat and SNP: 20.1%.

Proportion of votes which went to losing candidates: 50%.

Share of the vote won by SNP in Scotland: 50%.

Share of seats won by SNP in Scotland: 95%.

Share of the vote won by the Conservatives in England: 40.9%.

Share of seats won by the Conservatives in England: 59.6%.

Share of the vote won by the Conservatives in Scotland: 14.9%, the lowest of any government since 1945.

Share of the vote won by the Conservatives in Wales: 27.2%, the lowest of any government since 1945.

The party with the largest share of the vote and the lowest number of seats: UKIP 12.6% of the vote, 0.15% of seats (1 seat).

Average number votes per MP elected for UKIP: 3,881,099.

Average number of votes per MP elected for the Conservatives: 34,243.

Majorities, marginal & safe seats

Conservative majority: 11, the fifth smallest majority at a general election since the war, the smallest Conservative majority at a general election since 1852.

The seat with the smallest majority: 27, Byron Davies, Conservative, Gower.

The seat with the largest majority: 34,655, George Howarth, Labour, Knowsley.

Seat won with largest share of the vote: Liverpool Walton, Lab, Steve Rotheram, 72.3%.

Seat won with the smallest share of the vote: South Belfast, Dr Aliasdair McDonnell, SDLP, 24.5%.

Number of MPs elected with more than 50% of the vote: 331.

Number of MPs elected by more than 50% of the total electorate in their constituency: 3.

Number of MPs elected with less than 30% of the total electorate in their constituency: 191.

Members

Number of women elected: 191, 29% of the House of Commons, up from 141 (22%) in 2010.

Number of BME MPs: 41, 6%, up from 27 (4%) in 2010.

Average age of MPs elected in 2015: 51.

Age of youngest MP elected: 20, Mhairi Black, SNP, Paisley and Renfrewhshire South.

Age of oldest MP elected: 84, Sir Gerald Kaufman, Lab, Manchester Gorton.

Number of MPs elected who had never been MPs before: 177 (73 Con, 50 Lab, 49 SNP, 5 others).

Number of MPs from the previous Parliament who were re-elected: 468.

Number of returning MPs who had not sat in the previous parliaments: 5.

Number of University of Lincoln graduates elected: 2, Martin Vickers (Politics, 2004), Con, Cleethorpes; Andrea Jenkyns (International Relations and Politics, 2014), Con, Morley and Outwood.

Members of the House of Lords elected: 0.

Members of the House of Lords created since the election: 59 (as of 11 November 2015).


This post draws on a number of sources, most notably: the BBC general election results page; the House of Commons Library Research Briefing on the General Election, 2015; the Electoral Reform Society paper, The 2015 General Election: a voting system in crisis by Jess Garland & Chris Terry; and the House of Commons Library Research Briefing on Women in Parliament and Government.

Posted in Uncategorized | Tagged , , , , | Comments Off on The 2015 general election in numbers

The implications of English votes for English laws

IMG_2690The House of Commons Public Administration and Constitutional Affairs Committee is currently conducting an inquiry into the issue of English votes for English laws, and the wider impact of these proposals on the future of the Union. This is a short piece on the subject which I wrote for The Lincolnshire Echo in April, in the run-up to the general election. The Prime Minister had just used a speech in Lincoln to launch the party’s ‘English manifesto’.


David Cameron used a speech in Lincoln last week to launch a Conservative manifesto for England, and to restate the Conservatives’ commitment to what has become known as English votes for English laws. Under Conservative plans MPs representing Scottish constituencies would be prevented from voting on issues which only affect England.

There are, however, considerable practical and political difficulties to the implementation of such a policy. Firstly, it is far from clear what constitute English laws. While the Scottish Parliament can, with relative ease, take decisions which only affect Scotland, most decisions taken at Westminster, and particularly those relating to spending, have implications for the whole of the UK. There are also significant political and constitutional implications. Constitutional experts have warned of the dangers of creating two classes of MPs at Westminster, with Scottish MPs excluded from some votes, while English MPs vote on everything.

The proposals are also potentially divisive in other ways. If, for example, the UK were to find itself governed by one party, while the majority of MPs in England represented another, this could effectively give English MPs a veto over government policy. Moreover, given the likelihood that the majority of English MPs will be Conservative, it is not clear how those parts of England which do not traditionally vote Conservative will react. While support for self-government for the English regions has been muted, an in-built and powerful Conservative majority in England might well lead to renewed interest in regional government in some parts of England such as the North East, and the North West.

Playing the nationalist card at this point may well be an astute political move on the part of the Conservatives which may attract votes in places like Lincolnshire, but the challenges involved in implementing and the long-term implications of such a policy are far from clear.


Posted in Uncategorized | Tagged , , | Comments Off on The implications of English votes for English laws