The results of the first Who Runs Britain? opinion poll of this year are as follows:
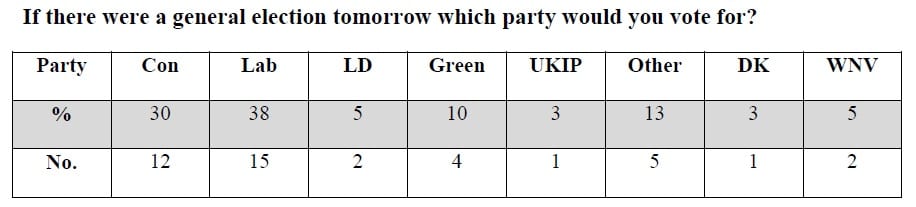
The other parties supported gained one vote each. They were: Left Unity; Libertarian; Monster Raving Loony; Socialist; Socialist Worker Party.
The figures were calculated as follows.
In calculating the percentage support for each party the I would not vote responses were excluded, ie the total used was 40 not 42.
In calculating the percentage of I would not vote responses, the figure for all responses was used, ie the total used was 42.
What does the poll tell us?
Important health warning: we should be careful about drawing any general conclusions from this poll beyond what it tells us about the voting intentions of those studying the level 1 politics module, Who Runs Britain? at the University of Lincoln in October 2014.
Professional polling organisations carrying out similar polls generally use a sample of around 1000 people, from across the UK, weighted to reflect factors such as sex, age and social class. Not only is the sample used in our poll very small, it is also somewhat unrepresentative of the rest of the population in a number of ways including: it is younger, it is not balanced according to gender, and probably contains few homeowners, people in full-time employment or indeed taxpayers, but consists entirely of students, and moreover, students who are interested in politics. In short it is in many respects rather unrepresentative of the population as a whole.
Small polls such as this become particularly problematic because relatively small changes in the number of responses to a particular question can lead to apparently significant changes in the percentages. Converting number of responses into percentages can create a false impression of the strength of support for a particular response, consequently it is always a good idea to look at the numbers involved as well as the percentage. A recent example of this involved a poll conducted by Lord Ashcroft following the Scottish independence referendum. This showed that 71% of 16-17 year olds voted in favour of independence, while 73% of over 65s voted no. This was widely reported at the time as indicating that the young had been deprived of independence by older voters. This was a large poll involving 2000 respondents, however, a closer look at the results revealed that the group of 16-17 year olds polled comprise just 14 individuals, while the over-65s comprised the largest group with 488 respondents.
Even if we set aside problems with the sample, because of the nature of the British electoral system it is difficult to assess what a result such as this would mean if it were reflected by voting in a general election. The system of first-past-the-post, which is used to allocate seats in British general elections means that the proportion of the vote won by each party is less important than the number of seats won. Under this system the country is divided into 650 constituencies of roughly equal size (in terms of population) each of which elects one Member of Parliament. The winning party is the one which wins the most seats. In order to win a seat a candidate merely needs to attract more votes than any other single candidate. This can, and often does, mean that a seat is won by a candidate with less than 50% of the vote, as long as the remaining share of the vote is divided between more than one other candidate. It also means that party’s can, and usually do, win a general election with less than 50% of the popular vote and that a proportion of the vote which is some way short of an absolute majority is usually transformed into a large majority of seats in parliament. For example, in the 2005 general election, Labour won about 35% of the popular vote, but won 55% of the seats in parliament, in the 2010 general election the Conservatives won 36% of the vote but only 47% of seats in Parliament.
The Who Runs Britain? poll does not reflect voting across the country and does not take account of the different constituencies in which those polled may be voting. It is impossible therefore extrapolate with any certainty about what this result would mean in terms of seats won in a general election. Nevertheless, it may be fun to indulge in some speculation about what these results might mean by comparing them with other polling data.
The National Picture
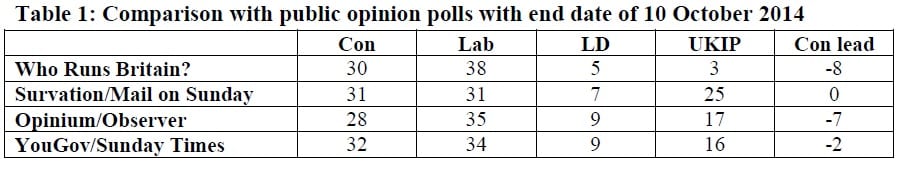
Despite all the caveats above, perhaps the most striking thing about this poll is that it is quite similar to recent national opinion polls (see table 1 below). There were three national polls which completed surveying on the date of our poll: Survation for The Mail on Sunday; Opinium for The Observer; and YouGov for The Sunday Times. Two of those polls put Labour ahead of the Conservatives, while the third, Survation, put Labour and the Conservatives neck and neck. The nearest poll to ours was the Opinium poll for The Observer, which had Labour seven points ahead of the Conservatives, compared to eight points in our poll.
All three polls have the Liberal Democrats polling in single figures although none as low as the 5% in our poll. Liberal Democrat fortunes have fallen significantly since they polled 23% in the 2010 general election, with poll ratings often in single figures. However, none of the major polling organisations have had them as low as 5% in national opinion polls since 2010, although they have dipped to 6% on a number of occasions. There may be very particular reasons why the Liberal Democrats have polled so badly in our poll, about which more below.
Perhaps the biggest difference between recent national polls and our poll is the fortunes of the UK Independence Party. UKIP have been polling in the mid to high teens for the last six months or so, and outpolling the Liberal Democrats for most of the last year. However, the 25% support for UKIP in the Survation poll is the highest UKIP has ever polled and is also somewhat anomalous. Survation polls have tended to show considerably higher support for UKIP than other polls with previous polls in the low twenties. The peak of support in this poll however, is also a reflection of the fact that the Survation poll took place entirely on Friday, the day after UKIP’s victory in the Clacton by-election which saw the return of their first MP. There was in contrast, very little support for UKIP in our poll. This may in part be explained by what we already know about the average UKIP voter which is that they tend to be older and are less likely to be educated to university level, although the latter may be explained by the former, ie if you are older, particularly over 60 you are less likely to have gone to university.
The level of support for The Green Party in our poll is also somewhat different from the national picture. The Green Party won 1% of the vote in 2010, which was enough to secure them a seat in Parliament. However, although their fortunes have increased a little since then, they are still polling in the low single figures in national polls. The relatively high level of support for the Greens in our poll, perhaps reflects their key support among young voters.
 (Source: http://ukpollingreport.co.uk/voting-intention-2)
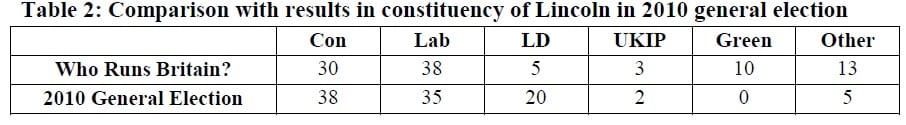
The Local Picture
It is also interesting to compare these results with some more local data. In the 2010 general election Labour lost the seat of Lincoln to the Conservatives with a 6% swing from Labour to the Conservatives. This was the first time since 1997 that the seat of Lincoln had changed hands, reinforcing the impression that Lincoln is a ‘bellwether’ constituency, that is a constituency which reflects what happens in the rest of the country, i.e. win Lincoln and win the general election. Obviously, the indeterminate outcome of the 2010 election might lead us to qualify this somewhat. Nevertheless, Lincoln is a key marginal seat, the current Conservative MP, Karl McCartney, has a majority of 1048 and Lincoln is 18 on Labour’s list of 106 target seats for the 2015 general election.
Another interesting thing about Lincoln is that the University and most of its students are located within one constituency. If one considers the size of Mr McCartney’s majority and the fact that there are over 12,000 students at the University of Lincoln the student vote could prove decisive. If the results of our poll were replicated across the University, Labour would get around 1000 more votes than the Conservatives. Although this would almost be enough on its own to wipe out the Conservative majority in Lincoln, we do need to keep in mind a number of factors: firstly, we don’t know how students in Lincoln voted in 2010; secondly not all students will vote and they won’t all vote in Lincoln. Typically turnout amongst students is generally quite low, and because students who are not from Lincoln also have the option of voting in their home constituency, the student vote tends to spread out across the country and as a result is rarely decisive in particular constituencies. Nevertheless, it may be that in the wake of the introduction of increased tuition fees, in the next general election the student vote will be more organised in which case in seats in places like Sheffield, Bristol, Cambridge and Lincoln, it may prove decisive.
Previous cohorts of Who Runs Britain? students
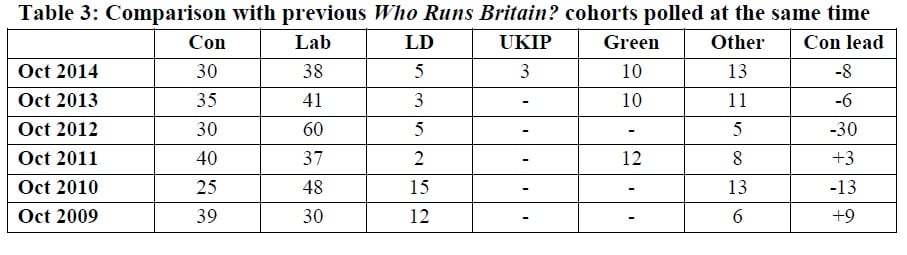
Perhaps the most interesting comparison, for me at least, is with previous cohorts of students on the Who Runs Britain? module. I began polling first year students on this module in 2009, a year which, like this year, had to include a general election. I polled each cohort at the beginning of their degree, and then on a number occasions throughout the year, usually five times a year in total. The table below compares this October’s poll with the previous five cohorts of students polled in October.
As a cohort the 2014 intake is a little more supportive of Labour than last year’s intake, which was perhaps closer to the national opinion polls than any previous cohort at this point. Interestingly, if we just look at the relative support for Labour and the Conservatives, this poll is almost the exact reverse of the poll in October 2009 which was also a general election year. Polls of the 2009/10 cohort did track pretty close to national trends throughout the year.
The tracker poll below shows the result of every poll I have conducted since 2009. If we look at the tracker poll, perhaps the most striking thing in these polls has been the decline in support for the Liberal Democrats. The Liberal Democrats enjoyed a high level of support amongst the 2009 intake and their support increased in the run-up to the 2010 general election. In the final Who Runs Britain? poll before the 2010 general election the Liberal Democrats secured 28% of the vote, six points ahead of the Conservatives. However, from this point Liberal Democrat support went into terminal decline. They still managed to secure 15% of the vote in October 2010, but the announcement in November 2010 of the introduction of £9000 tuition fees, which the Liberal Democrats had promised to oppose when in Opposition appeared to seal their fate, at least amongst students on this module. In the final three polls of the 2010 cohort (February, March and May 2011) only one student voted Liberal Democrat, and only once (in March 2011). The Liberal Democrats have fared little better since, no more than three students have voted Liberal Democrat in any individual poll since November 2010, and then only twice. The two votes they secured in this poll suggests their fortunes have not improved.
It is hard to know who exactly has benefitted from this decline in Liberal Democrat support in these polls. There has certainly been an increase in support for other smaller parties most notably the Green Party, who have been outpolling the Liberal Democrats on and off since 2011, as they have in this poll. But there is also some evidence that support may have shifted to some of the other smaller parties.
![]()
Turnout
Perhaps not surprisingly given that this is a poll of politics students, only two people declared that they would not vote if there were a general election tomorrow, and only one was undecided. This suggests a turnout of over 95% of those polled which is much higher than at any general election since the Great Reform Act of 1832. Turnout at general elections in the UK since the Second World War has generally been between 70%-85%, although in recent elections it has been lower. Turnout at the 2010 general election was 65% up from a record post-war low of 59.4 in 2001. However, if instead we calculate turnout on the basis of the number of students who should have been able to vote the figure drops somewhat. There are 55 students on this module but only 42 were in the lecture at which the poll was taken, and only 40 said they would vote, which provides a turnout of 73%. This is still higher than recent general elections but lower than I would expect for a first year lecture at this time of year and considerably lower than the 90% turnout for the same poll conducted last year!
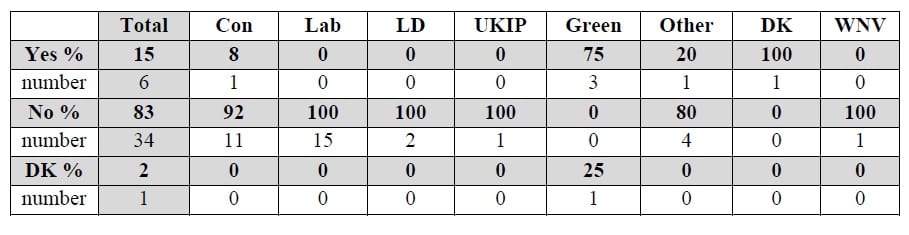
Polling on a written constitution
I also polled on whether Britain should adopt a written constitution. This will form part of our submission to the Political and Constitutional Reform Committee’s inquiry on a New Magna Carta. The results of this poll were decisive with the majority of students, 83% or 34 out of 41 students, irrespective of party, stating that they did not believe that Britain should adopt a written constitution. Only 6 students supported the idea, while 1 was undecided. Supporters of the Green Party were the only group to express significant support for a written constitution.
There is not a significant amount of polling data on attitudes towards a written constitution. Research carried out by the Constitution Unit at University College London, for the Political and Constitutional Reform Committee does summarise recent polls on the question, all of which indicate strong support for a written constitution. In particular the periodic ‘State of the Nation’ poll conducted by the Joseph Rowntree Foundation found that in four polls between 2000 and 2010, between 68% and 80% supported the adoption of a written constitution. Although the UCL research cautioned that these data do not perhaps reflect what the public would think after a prolonged debate on the issue, including what would presumably be a strong ‘no’ campaign. They also note that while polls tend to indicate support when the public is asked about whether or not Britain should adopt a written constitution, there is little evidence for a strong public appetite for this, pointing to the 2008 Hansard Society Audit of Political Engagement which showed that respondents ranked ‘Britain’s unwritten constitution’ as the least pressing constitutional problem affecting the UK, far below issues such as Britain’s membership of the EU, how political parties are funded and House of Lords reform.